590 Fall 2026 Week 8: 10/27-10/29/26. Changing the graph paper.
Agenda
- Yifan on PENTA and Dutch
- Common transformations for tone/intonation
- Intro to normalization and transforms
- Modeling normalization example: C-CURE
- Next week prep: watch neural nets videos; on horizon: lab on first half of class coming in next week
Rose (1987): Considerations in the normalisation of fundamental frequency of linguistic tone
Emphasis on normalization for vowels compared to tones/intonation still true today
In contrast to the large amount of theoretical and empirical work done on vowel normalisation, the normalisation of the acoustical correlates of intonation has received very little attention, and the normalisation of tone even less. This is a pity, because without normalisation it is not possible to take the first step in defining the phonetic and phonological features of a particular variety, namely, separating those features of the acoustic signal which are characteristic of the individual from those which characterise the particular variety. (Rose, 1987, p. 344)
What is the purpose of normalization?
Vowel normalisation aims for a maximum reduction in B-S [between speaker] variance without sacrificing the desideratum of making perceptual sense. The notion of perceptual sense, which thus serves to evaluate the numerical strategy, can be understood in two ways: normalised values should correctly reflect the transcriber's auditory impression (Disner, 1980, p. 256), and normalisation should ideally model the actual process of the listener's perceptual normalisation. (Rose, 1987, p. 347)
- However, Rose points out that it is hard to judge on the basis of perceptual criteria, because we still don't have a grasp of all the acoustic properties beyond f0 that contribute to pitch perception (that is still true! and a good point about how f0 is an abstraction)
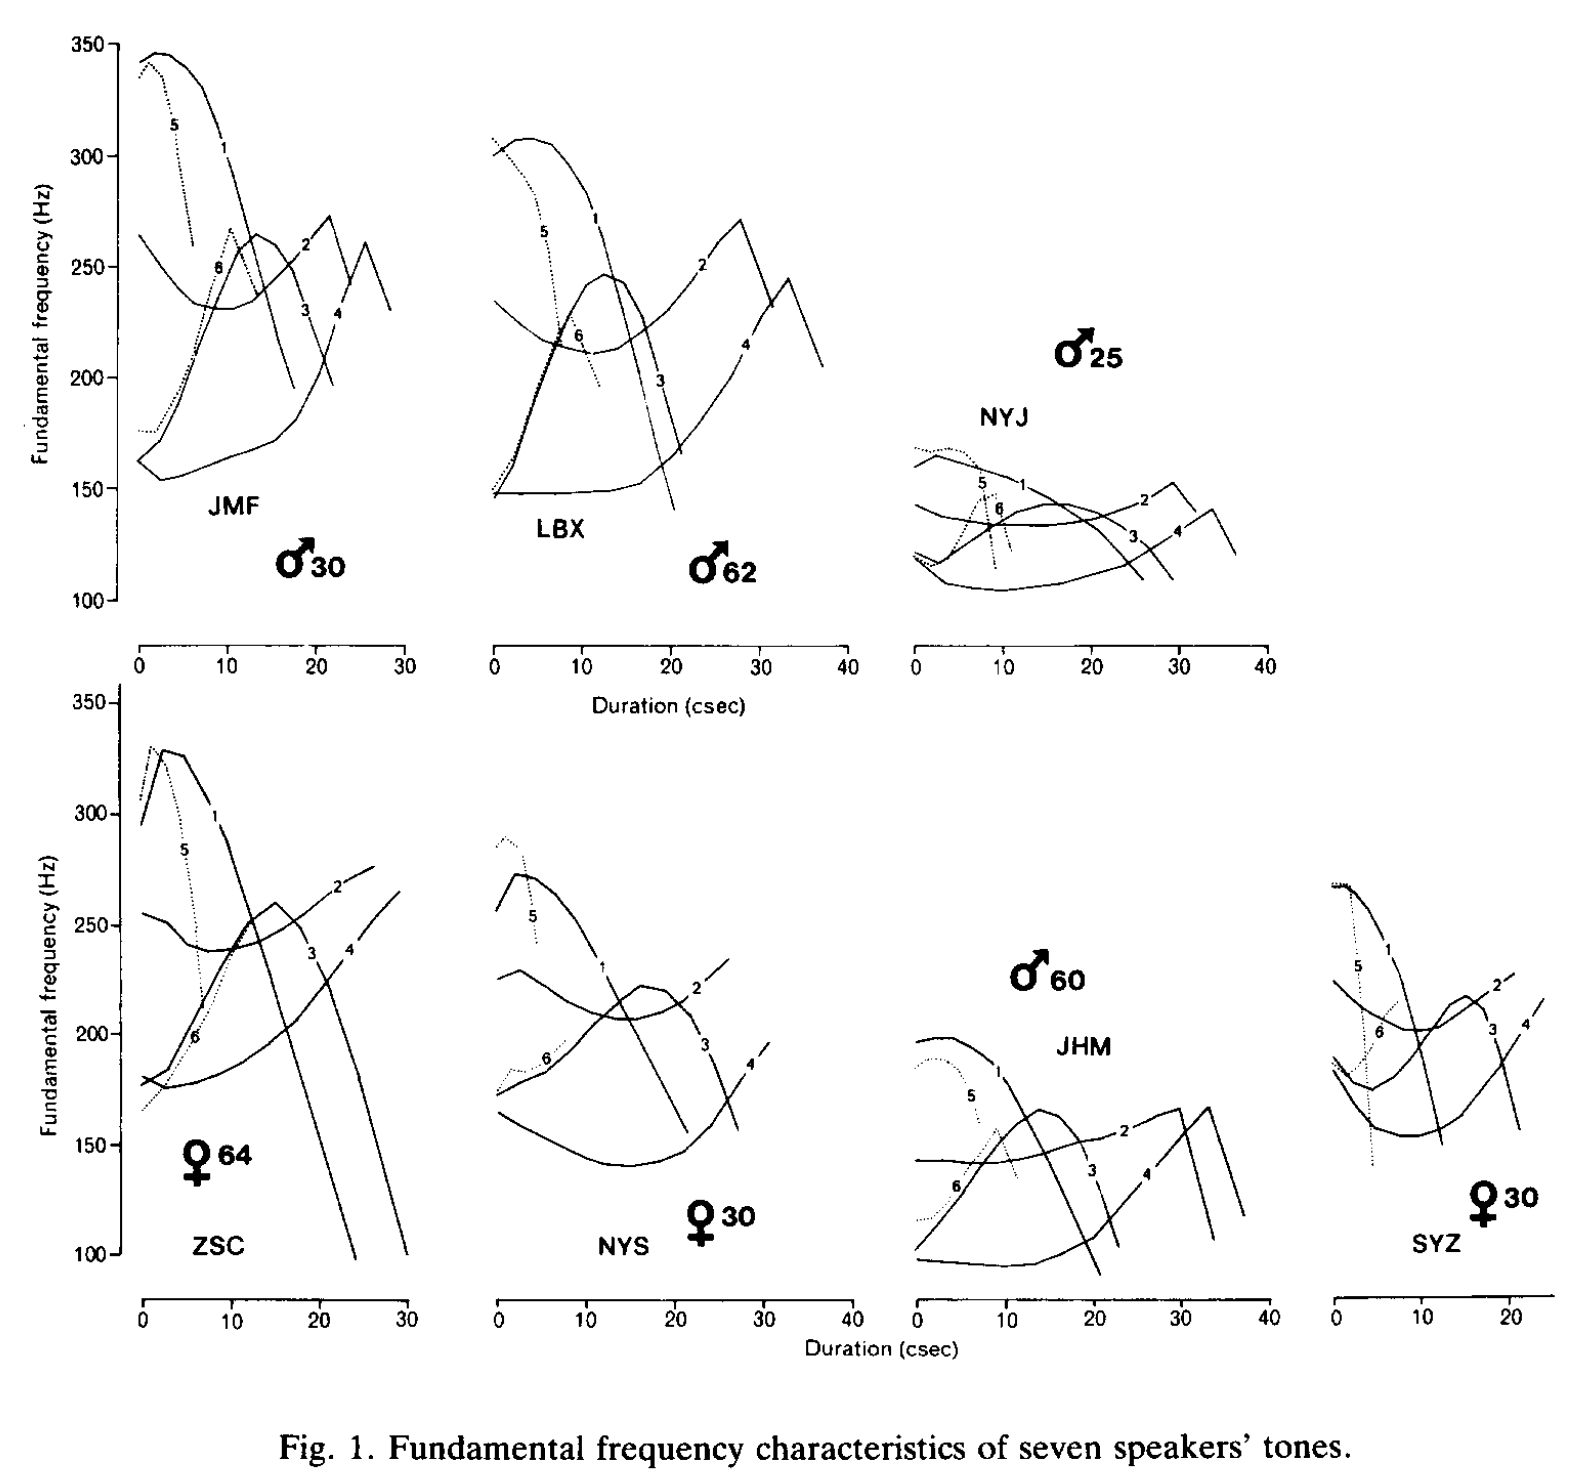
Compare Rose (1987), Figure 1, mean raw f0 traces below of seven speakers of Zhenhai (Wu--see Rose's Wu tones page!) which has an inventory of 6 tones to z-scored f0 traces, tone f0 contour shapes taken from page 345:
- T1: high falling
- T2: level than rising in mid pitch range
- T3: convex in low half o pitch range
- T4: low rising into mid pitch range
- T5: very high level or high falling
- T6: short low rising into mid pith range
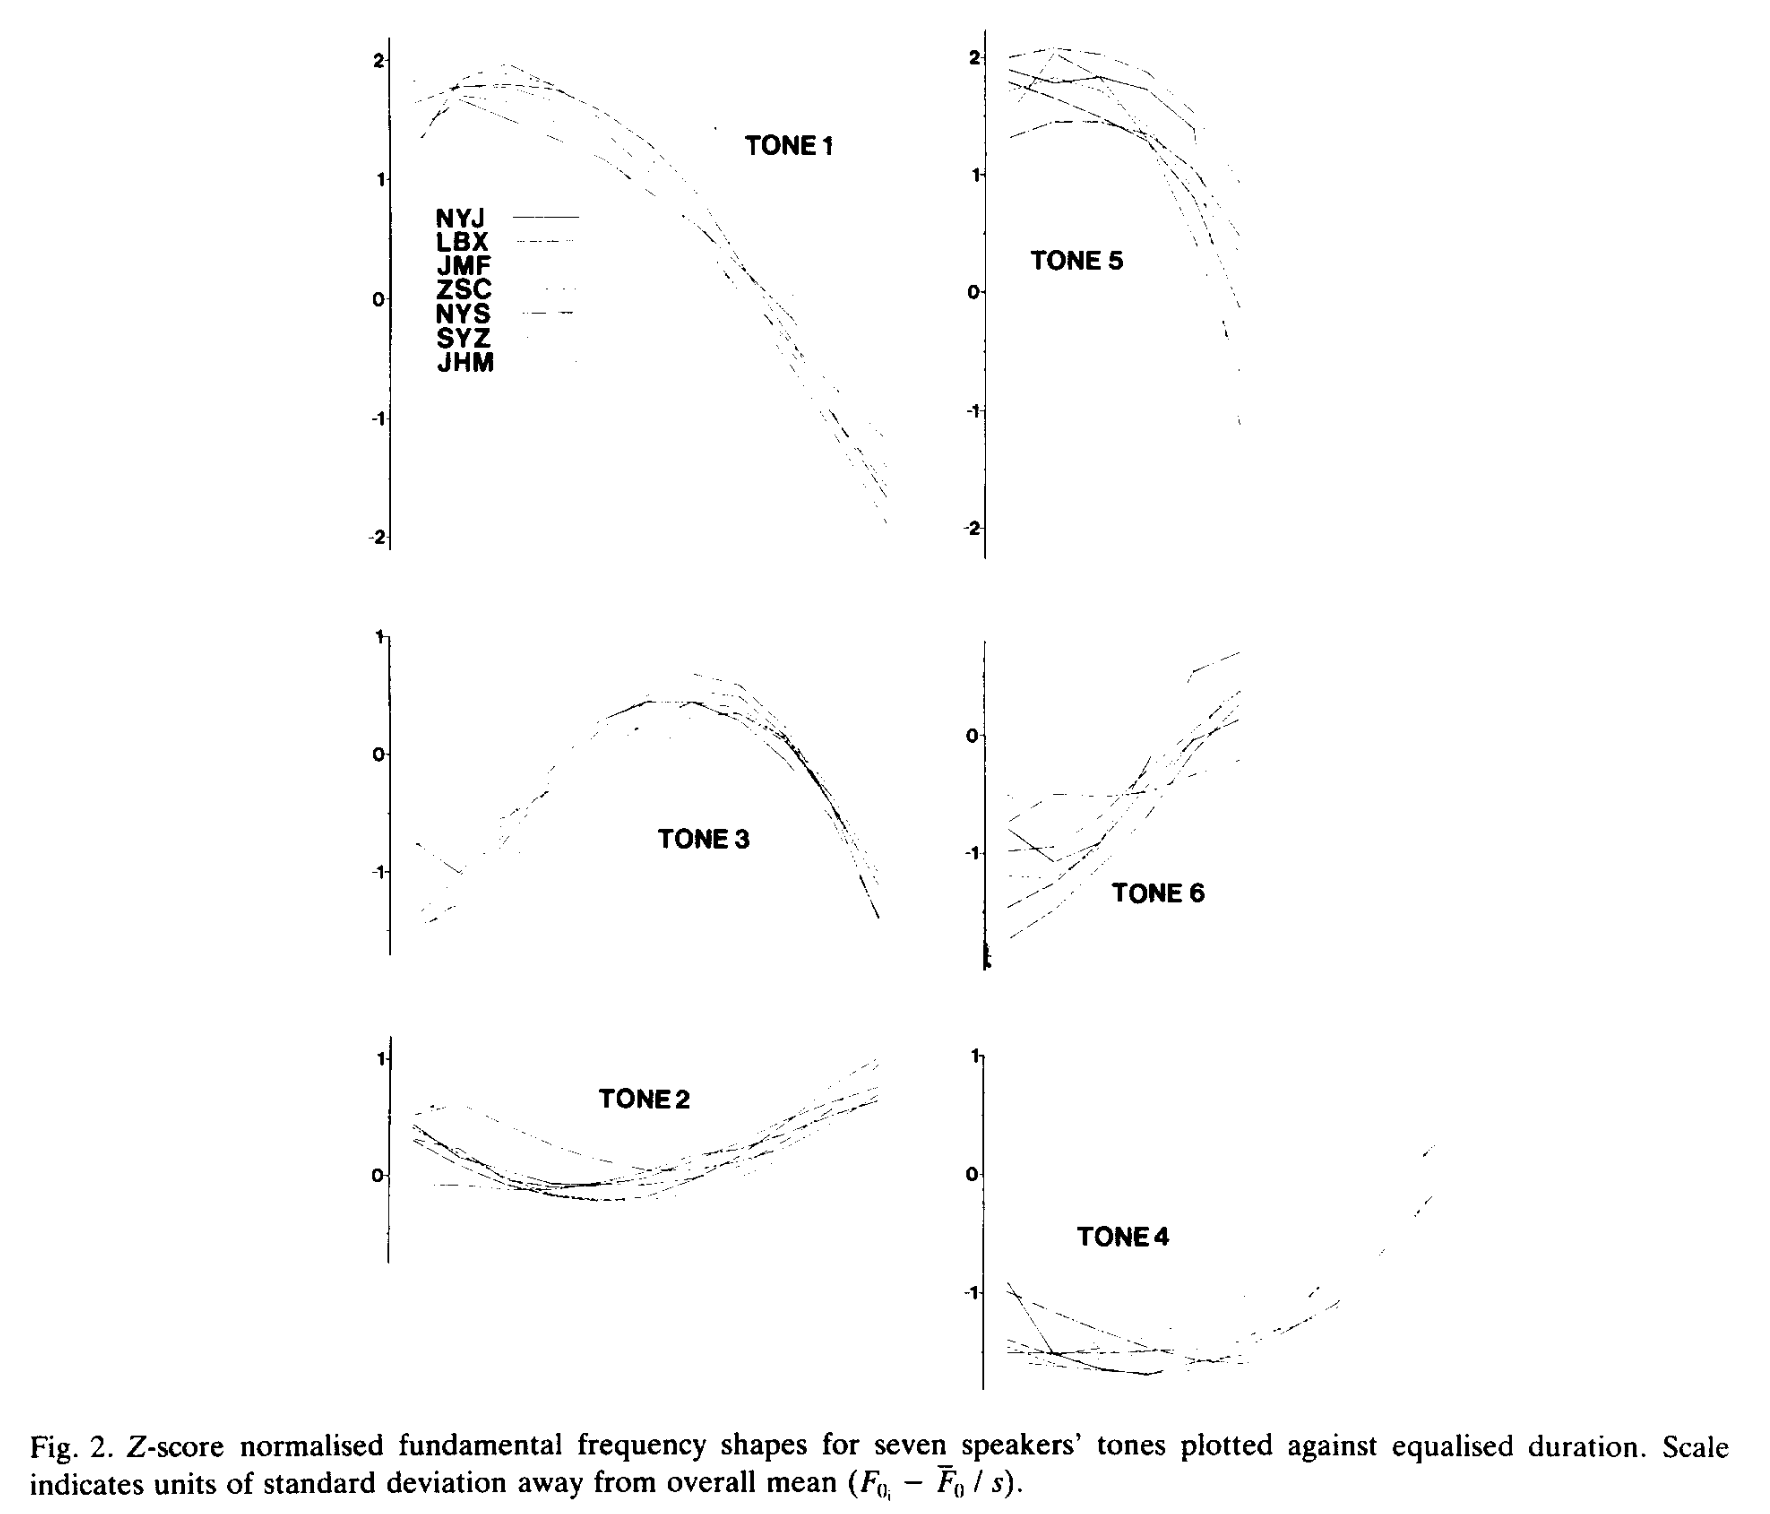
- What values should be considered for characterizing an individual speaker's f0 distribution? How do you "subtract" away the effect of an individual?
- Rose (1987) gives a general equation, which two more specific versions of transformations to consider: fraction of range (FOR) and z-scores.
- Here is the general equation:
- \(\text{F0}_i\) refers to the \(i\)th F0 value in the F0 trajectory
- \(\text{F0}_{ref}\) refers to some reference F0 value
- \(\text{F0}_{range}\) refers to some operationalization of F0 range (or more generally, some estimate of the speaker's F0 distribution)
\[\text{F0}_{norm, i} = \frac{\text{F0}_i - \text{F0}_{ref}}{\text{F0}_{range}}\]
- Now here are the specific versions
- Fraction of range: \(\text{F0}_{range}\) is estimated using point estimates for maximum F0 and minimum F0
\[\text{F0}_{norm, i} = \frac{\text{F0}_i - \text{F0}_{min}}{\text{F0}_{max} - \text{F0}_{min}}\]
- z-scores: \(\text{F0}_{range}\) is estimated using the whole distribution, where \(\overline{\text{F0}}\) is the mean F0, and \(s\) is one standard deviation about the mean.
\[\text{F0}_{norm, i} = \frac{\text{F0}_i - \overline{\text{F0}}}{s}\]
- In what sense is standard deviation a way to operationalize range? Play with this Desmos normal distiribution notebook.
- Note that the mean and standard deviation are sufficient statistics for a Gaussian/normal distribution, see Table 3.1 below from Duda, Hart, and Stork (2001): they alone provide all the information about the sample for estimating the population.
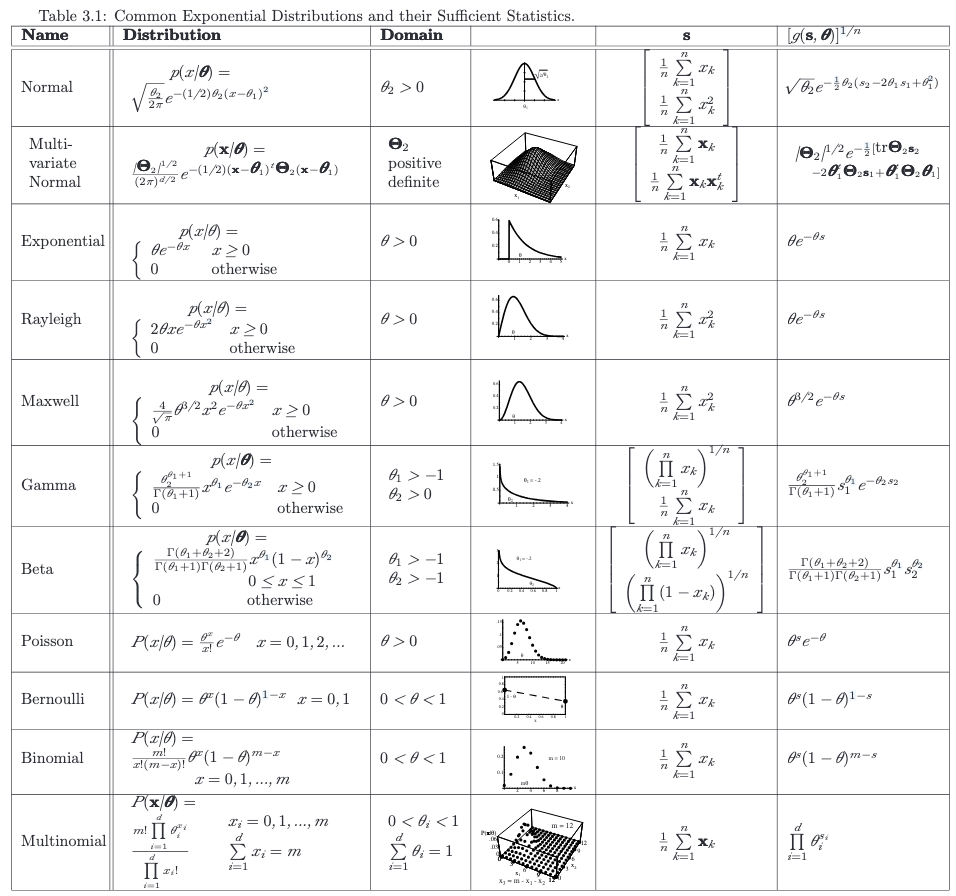
The question for both of these normalization transforms is what values should be consiered in characterizing the f0 distribution?
For FOR range values, Rose (1987, p. 348) points out:
Range-defining (RD) points are values that are assumed to be equivalent between speakers, but unless they can be identified by external criteria, the normalisation becomes circular. (An FOR normalisation requires R-D points, but which points are equivalent between speakers only becomes clear after normalisation.)
- Also extreme values could be outliers, e.g., from segmental perturbation or nonmodal phonation
- Taking points that have low within-speaker variance? What happens if we take T1 offset as \(\text{F0}_{min}\) (which is a point of low within-speaker standard deviation)?
For z-scores, Rose (1987) says:
The NPs [normalization parameters] were calculated for each speaker from the set of his sampled mean F0 values in Table 1, excluding values at onset (0%), and offset (100%) in T5 (i.e., 49 data points for each speaker).” (Rose, 1987, p. 349)
...as Disner (1980, p. 257) has pointed out for normalisations of different vowel systems, Z-score NPs should only be calculated from samples that are comparable (i.e., transcriptionally equivalent) to avoid biasing.” (Rose, 1987, p. 348)
- But what counts as comparable?
- Typically people just take all F0 values from a speaker to compute mean and standard deviation for z-scores: it's a bag of F0 values. What could be problems with that?
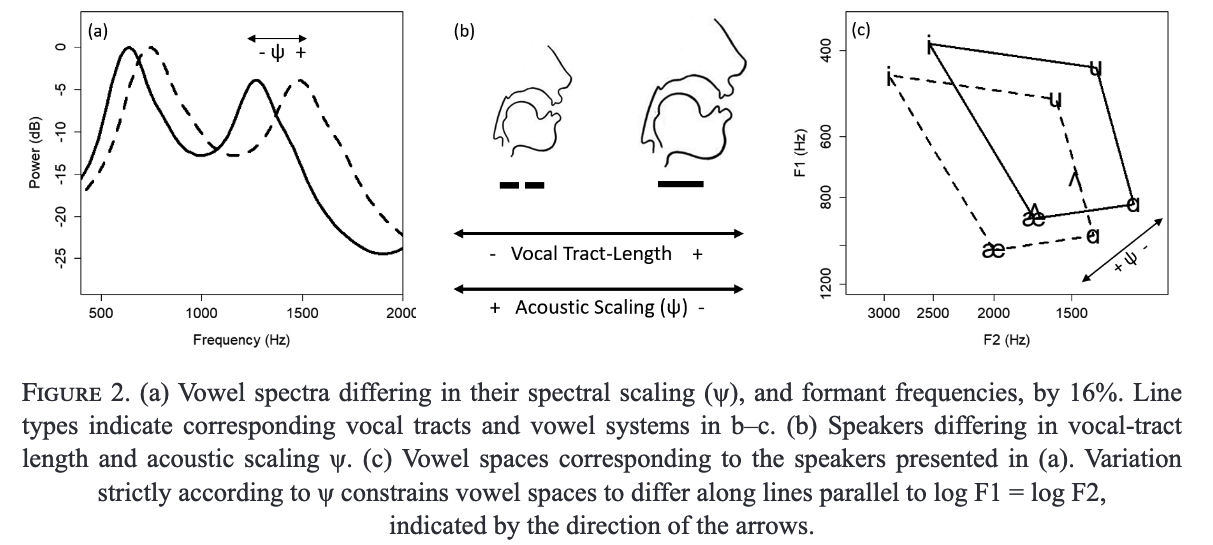
FOR and z-score transformations are called affine transformations (linear transformations + translation), and are an example of "changing the graph paper".
See also Wu (1999) p. 45, Section 3.2, Normalisation...
Changing the graph paper
The key idea: if we had the "right graph paper", then the relations between phonological categories would be "simpler"---we'd reveal systematic patterns that wouldn't otherwise be as apparent if we had a less-optimal graph paper for understanding how the categories lie in space. And maybe speakers/listeners use this graph paper too!

Changing the graph paper: exercise from Mark Liberman COGS501
- See R notebook
590-F26-graph-paper-exploration.Rmd in code/w8_norm in Google Drive folder.
- Acoustic, "data-analytic" approach
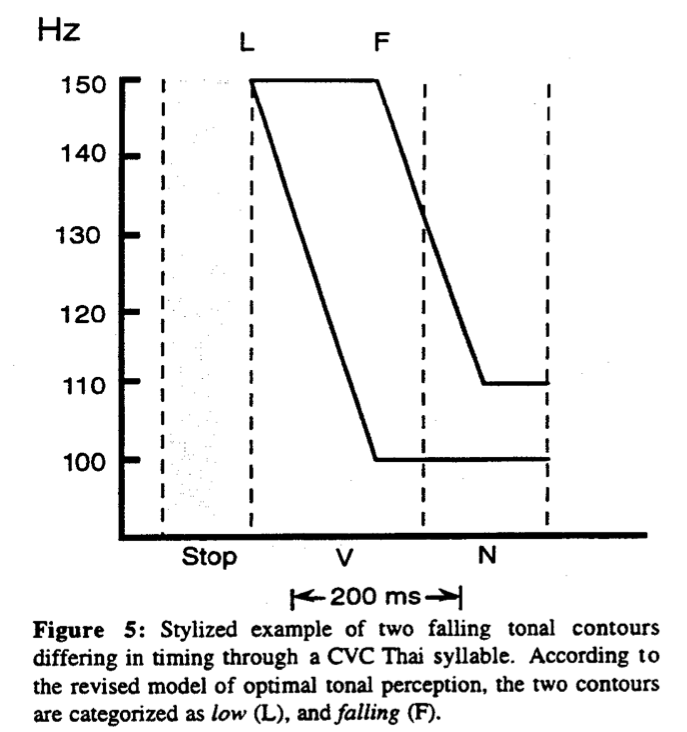
What's the clock? Does the clock vary?
- Absolute time, e.g., in ms, like a constant sampling rate over all utterances, not conditioned on any factors, no change over different domains
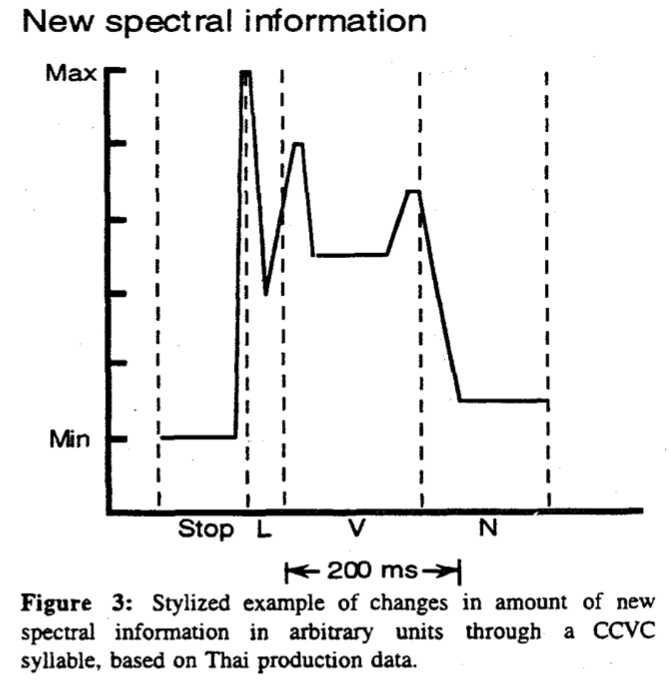
- "Phonological" time, e.g., segment out phonological units like the onset, rime, nucleus, segments, etc.
- Then "normalize" over the phonological unit! (typically linear -> see Praat demo)
- Constant sampling rate over each phonological unit across some population of utterances, e.g., across speakers, across tones, etc.
- (Then what happens to absolute duration as a piece of information? You can add this information in separately in regressions...but is that sufficient for modeling what's happening?)
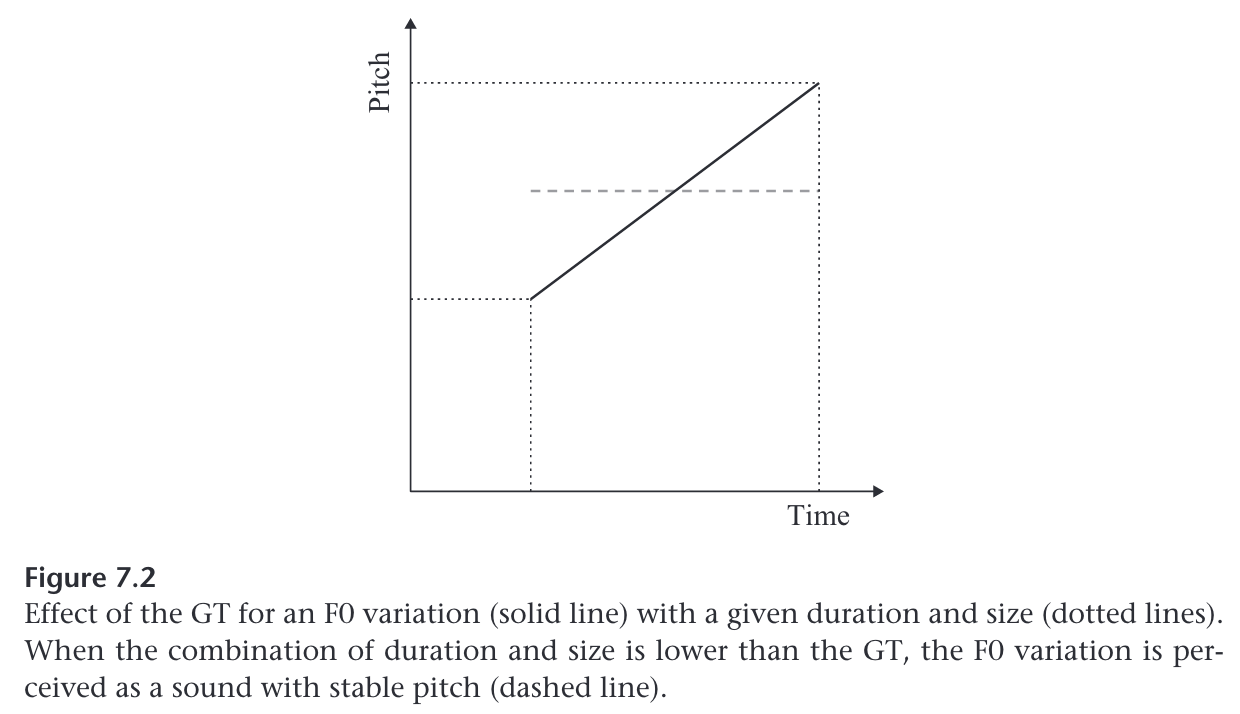
Perceptual motivation for clock choices
Modeling normalization
Computing Cues Relative to Expectations, C-CuRE
- Idea: not all cues should be treated the same (or treated the same by listeners)! Some should be considered in context--doing so then reduces variation in the acoustic signal
- Implementation: "subtract out" effect of context for a given cue.
- Example, adapted from McMurray, Cole, and Munson (2011) p. 207-208: let's say we are looking at f0 as acoustic property, a cue for recognizing tone class. Let's assume two tone classes, High and Low. A linear regression with F0 as the dependent variable (let's say, just for illustrative purposes, F0 at the midpoint of the rime) would look like this:
\[
\text{F0}_{rime} = \beta_{0} + \beta_1 \cdot \text{tone}
\]
where
- tone is the dummy-coded tone class variable, say, 1 for High and 0 for Low
- \(\beta_0\) is the y-intercept
\(\beta_1\) is the slope
From now on we're just going to write F0 for F0\(_{rime}\) to make the subscripts simpler.
There are also other factors that affect F0, such as speaker identity, and the vowel (intrinsic F0 effects) and we include these as well in the linear regression:
\[
\text{F0} = \beta_{0,all} + \beta_{tone} \cdot \text{tone} + \beta_{speaker} \cdot \text{speaker} + \beta_{vowel} \cdot \text{vowel} \ldots
\]
- Once we compute the linear regression we then get the \(\beta\) coefficient weights for each factor.
- Then we can use the equation to predict what value of F0 we expect, given the factors, i.e., given the tone class, the speaker, the vowel, etc. This gives us the expected value for F0, given the context/tone class
- We can then remove the effects of a source of variation in F0, say the speaker effect:
\[
\text{F0} = \beta_{0,speaker} + \beta_{1,speaker} \cdot \text{speaker}
\]
Once we have computed the coefficients from the speaker-only linear regression, we can residualize F0:
\[
\text{F0}_{resid} = \text{F0}_{measured} - \left(\beta_{0,speaker} + \beta_{1,speaker} \cdot \text{speaker}\right)
\]
- Then use the \(\text{F0}_{resid}\) as the new dependent variable in linear regression with other factors to see if the affect remaining variance in F0 after speaker effect is partialed out
- And use \(\text{F0}_{resid}\) as an independent variable in a linear regression taking residualized values as input for identifying tone classes.